Investigation
First steps
Make sure you’ve followed the infrastructure setup guide before following up with this page.
Upload evidence to Timesketch
Plaso files can be found here.
- Head to http://localhost:5000/, sign in with
dev/dev, or if using k8s installation retrieve the password through the post installation notes (e.g.helm status my-release). - Click on “Blank Sketch”, and give it an appropriate name (e.g.
YetiGuide) - Click on “Add Timeline”, and select the one of the plaso files you downloaded.
- The file will upload and you will be sent to the “Sketch view”
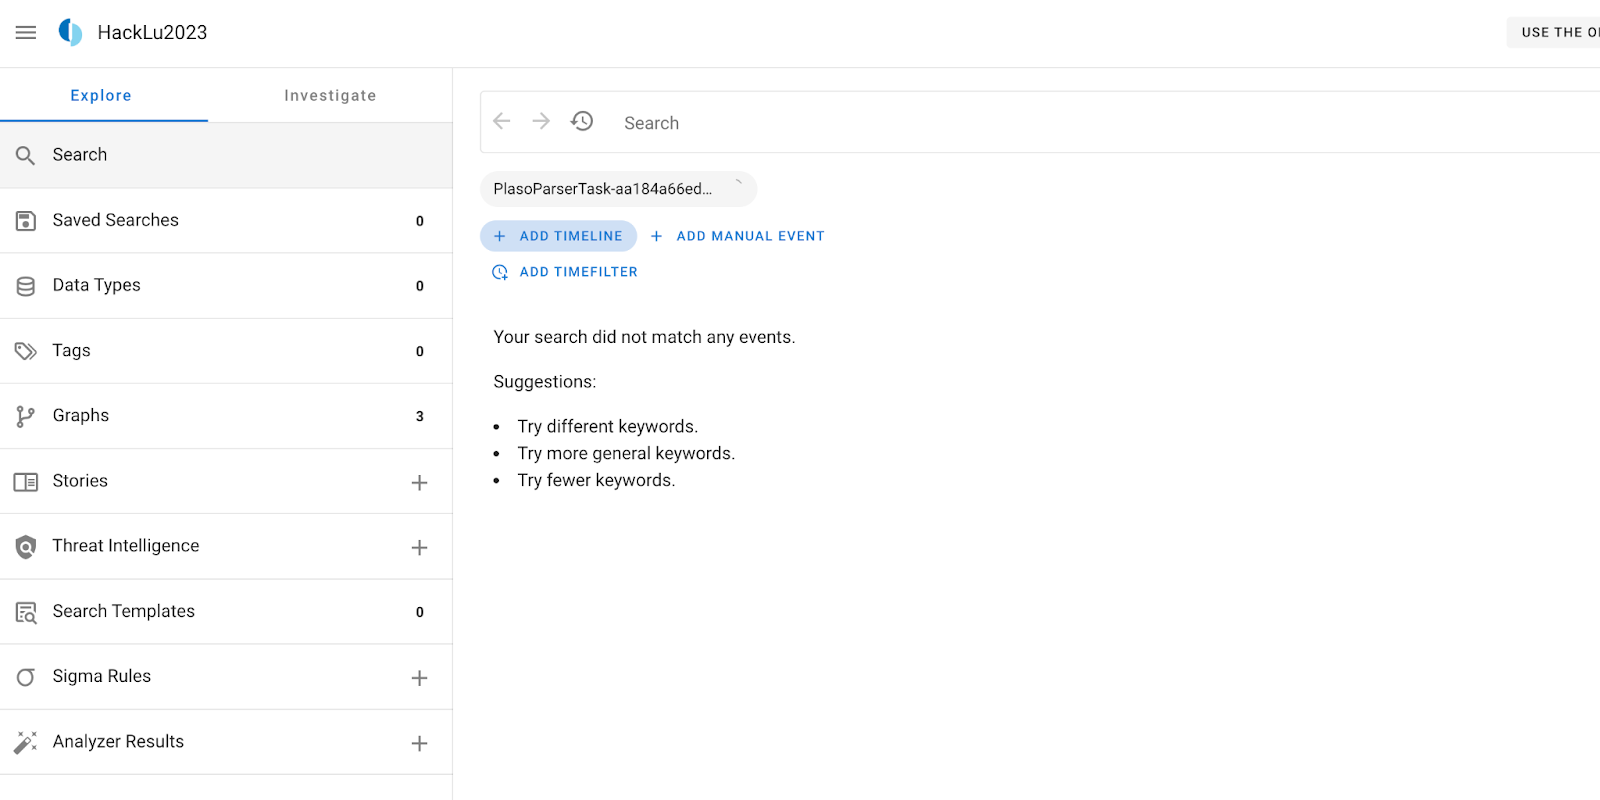
- Continue adding all the other plaso files by clicking on “Add Timeline”, and repeating the process above
- Once you see something like this, you’re on good track!
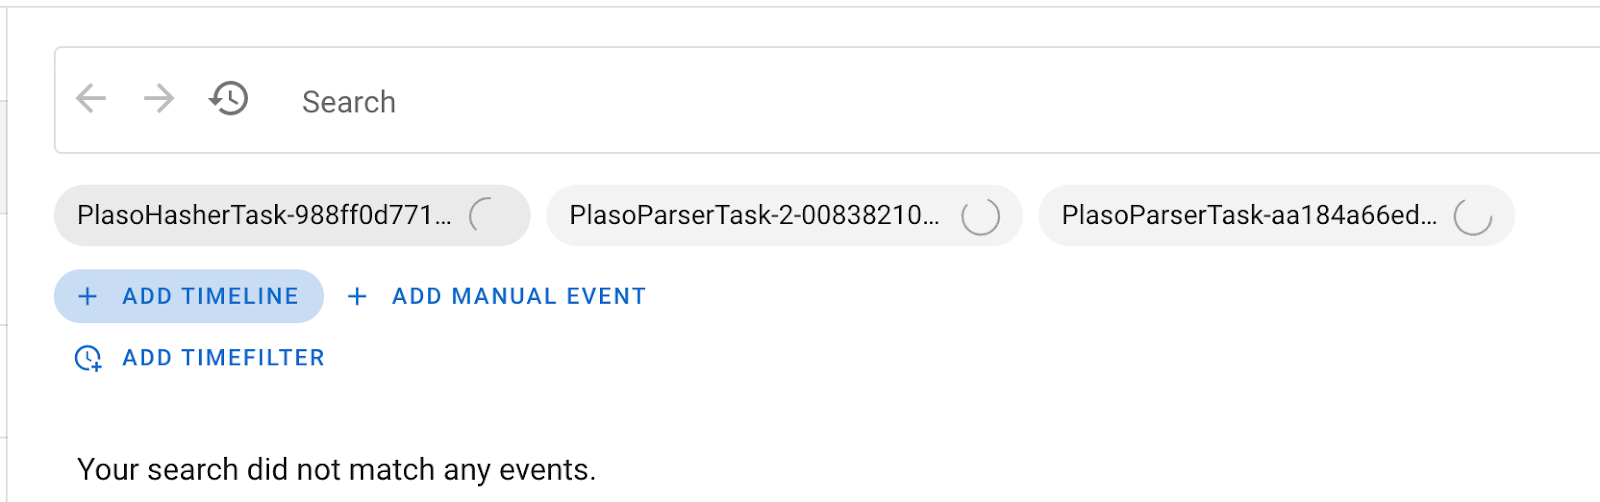
It will take a few minutes for the timelines to process, depending on how powerful your workstation is. Now’s a great time to take a break, or follow along with the instructions for Yeti below.
Add some intel to Yeti
Before we jump into the analysis of our timelines, it’s a good idea to add some intel first to Yeti to get you started. We’re going to document what a SSH accepted login looks like in our logs.
New Attack Pattern: SSH login
Head to http://localhost:80/ and log in with the
credentials you set up before. If you’ve followed the Docker installation, this
should be yeti / yeti. For K8s installation, the password can be retrieved
from the post installation notes. Then head to “Entities”, and on the
right-side panel click “+ New entity”. From the dropdown menu, select
“Attack pattern”.
- Name:
SSH login - Kill chain phases:
exploitation - Description: Optional.
Click “save”. Congrats, you’ve added your first attack pattern to Yeti! You should be redirected to the corresponding details page.
New indicator: SSH accepted login
Now head over to “Indicators” in the menu bar. We’re going to add a “regular expression” that captures what we’re looking for. Like previously, head to “+ New indicator”
Pick “Regular expression” from the dropdown, and fill it in as follows:
- Name:
SSH accepted login - Pattern:
Accepted (publickey|password) - Relevant tags:
ssh,login - Location:
syslog - Diamond model:
capability - Description: Optional
Click “save”. Now, time to link the indicator to our attack pattern!
Tag the attack pattern and link it to the indicator
Head back to the details page of the attack pattern you just created.
In the Tags box on the right of the page, add the tag triage and click
save. This tag will be used by Timesketch to filter out entities that should be
taken into account for the triaging process.
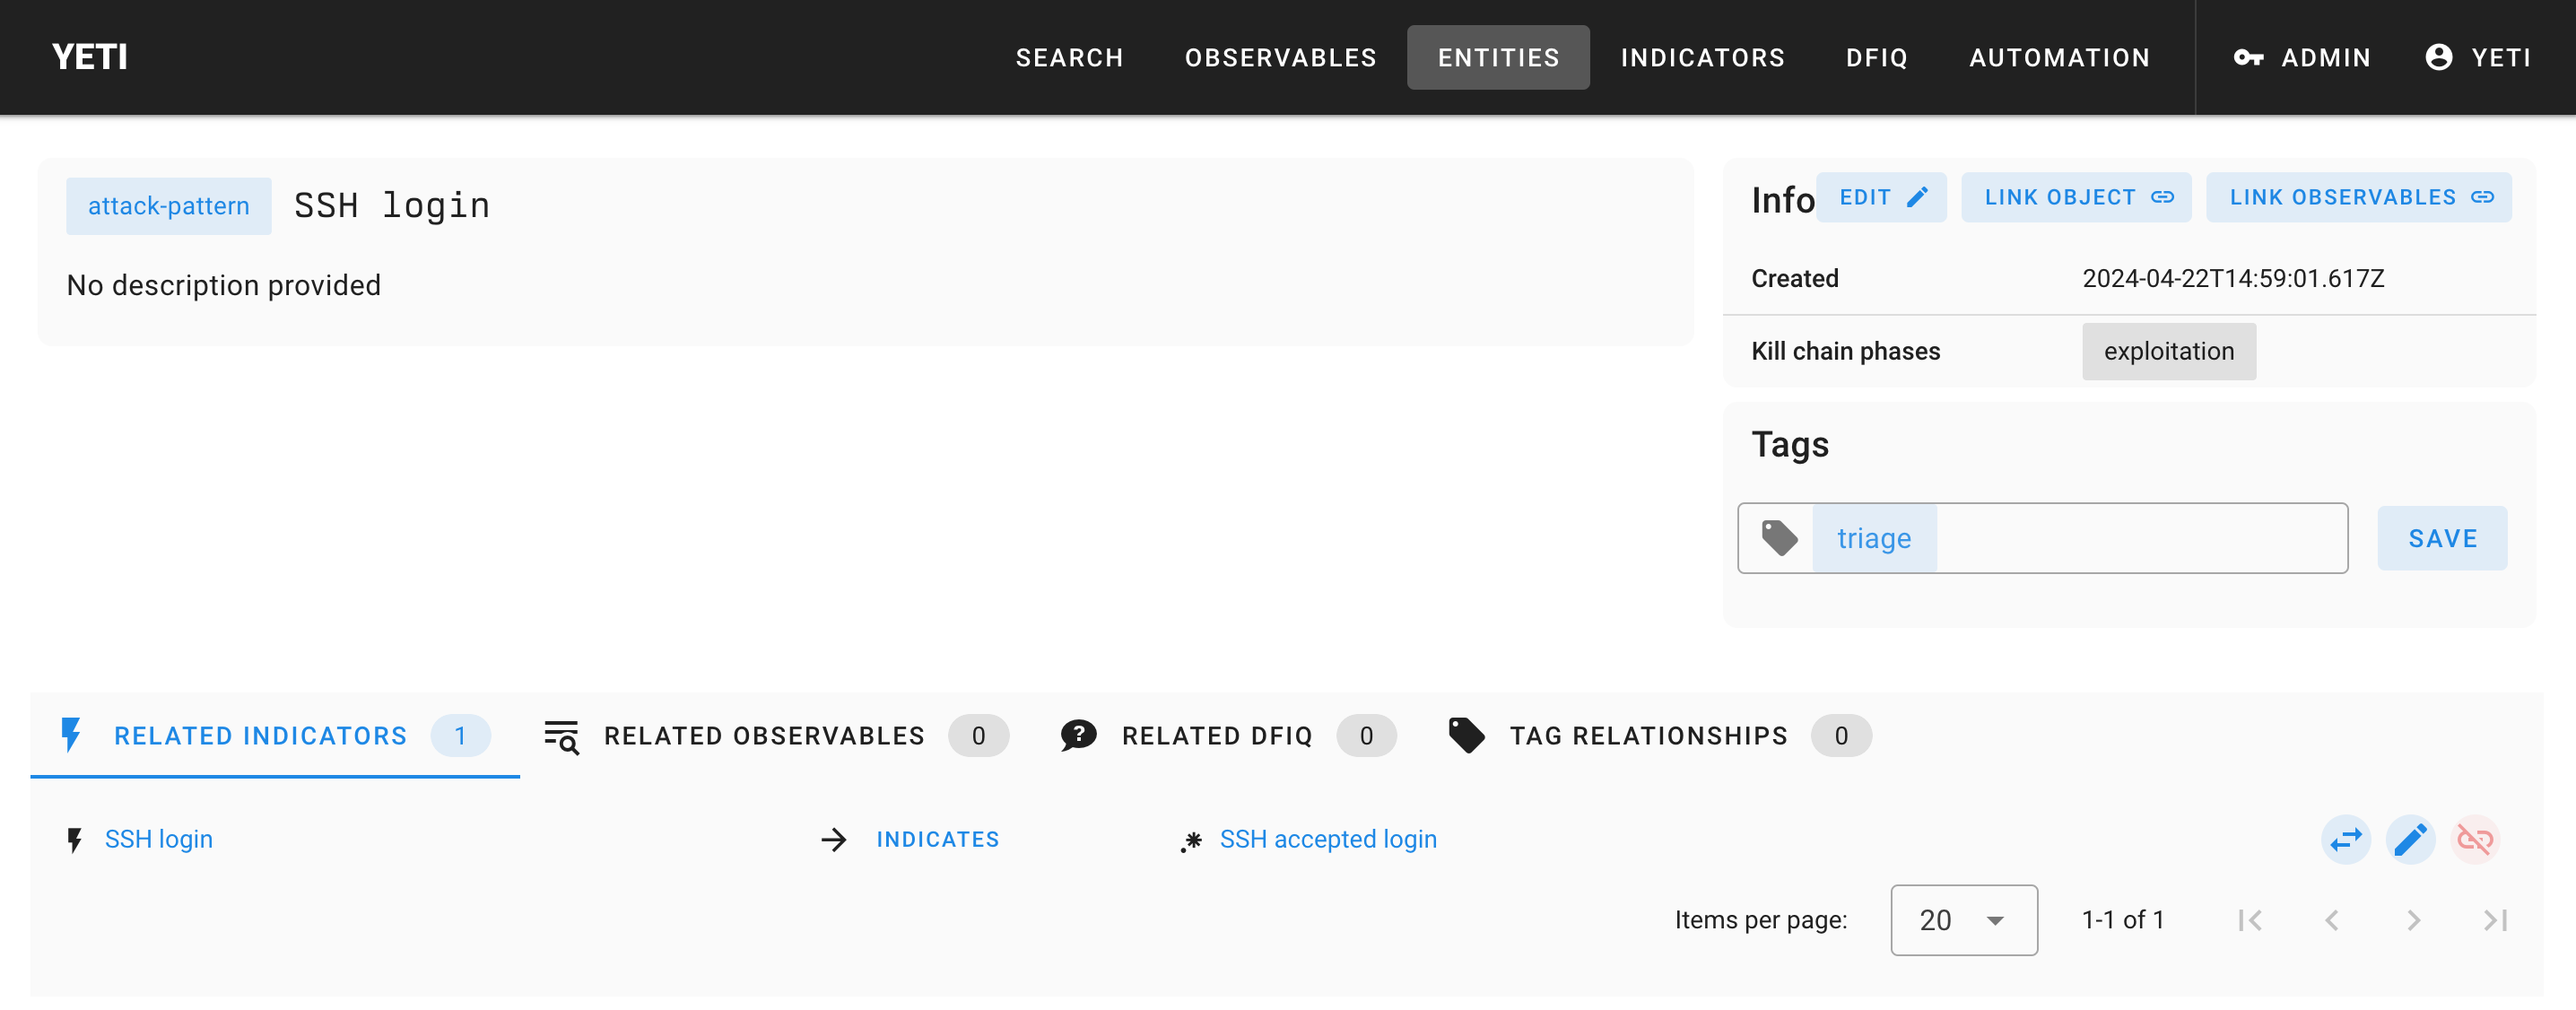
Then, link the attack pattern to the indicator you just created. On the top-right corner, click Link object in the Info box on the top-right corner. Start typing SSH login. Set link type to indicates and click Save.
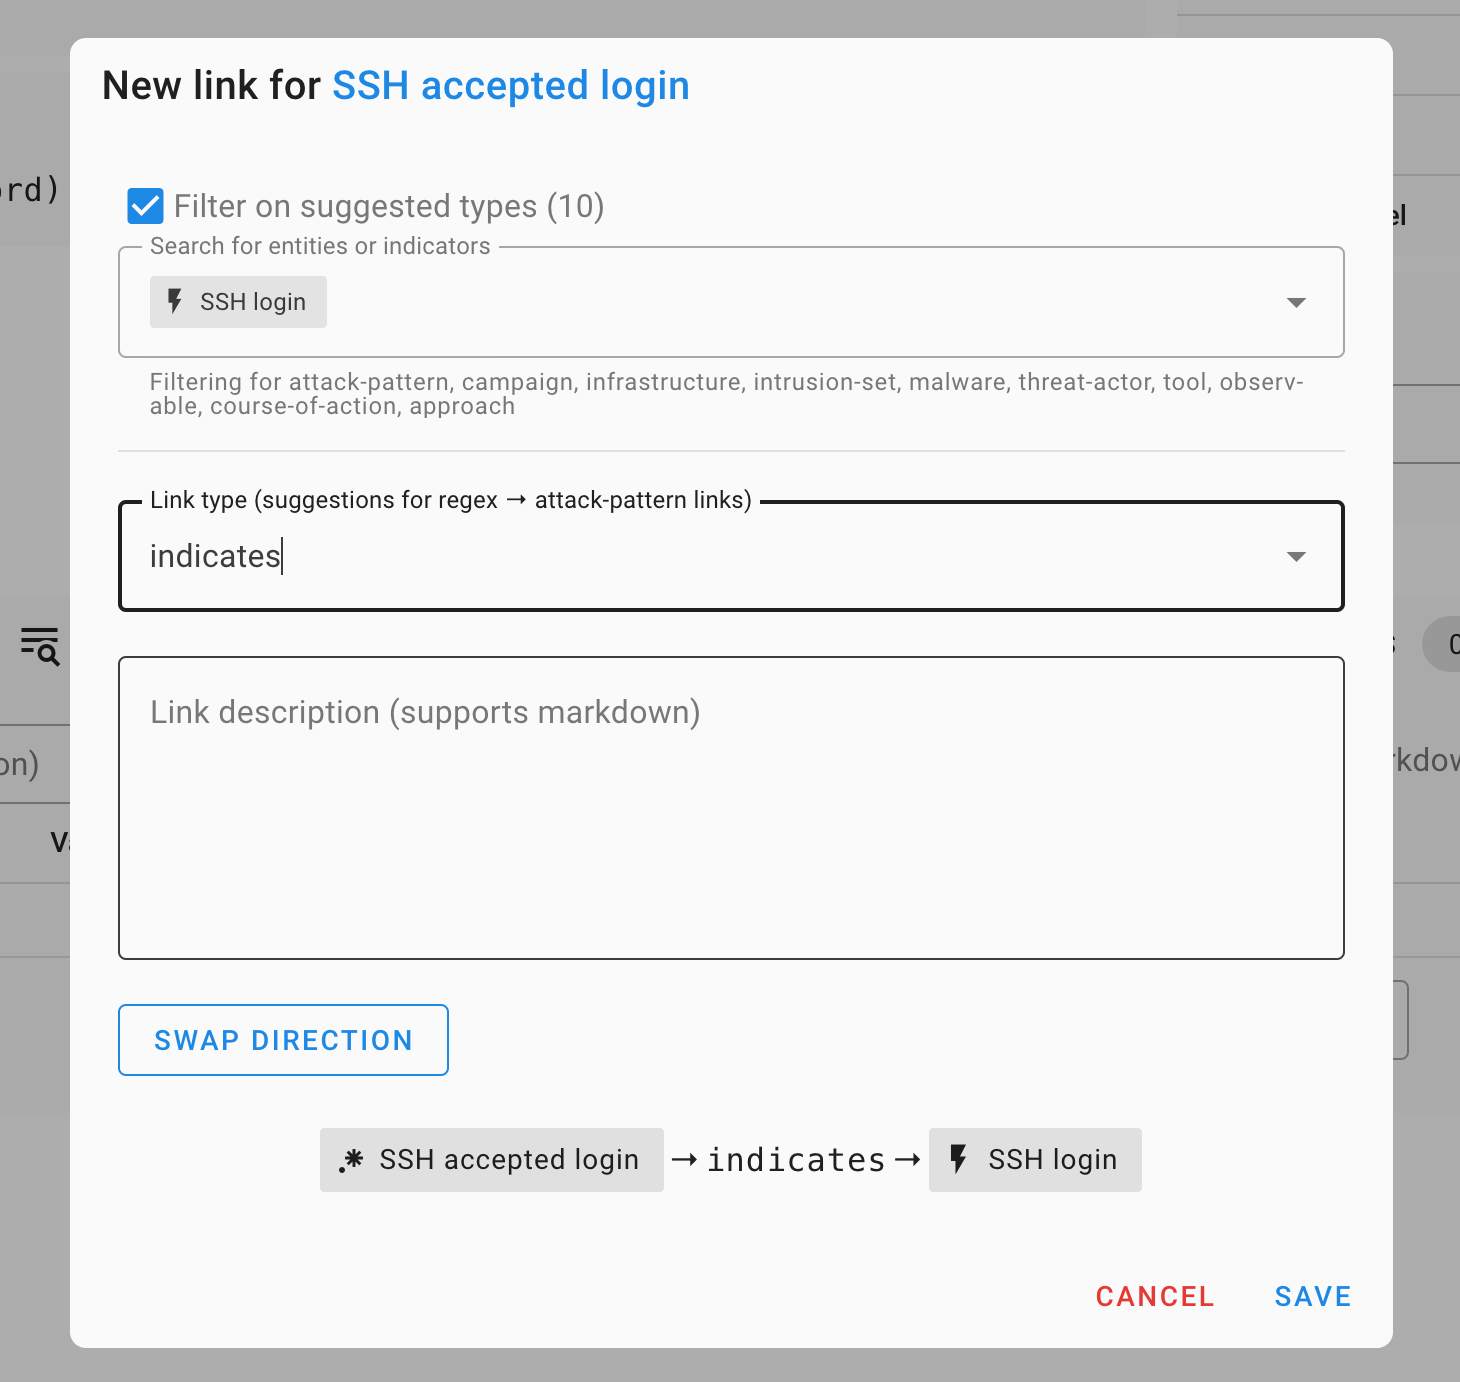
The final result should look like this:
Analyze the evidence
Some context: as in every forensic investigation, context is critical. What are these files you’ve been given to analyze? What are you even looking for? In this case, we’ve been given some evidence coming from a GCP VirtualMachine on which our detection systems have seen abnormal CPU usage.
Head back to Timesketch
(http://localhost:5000/sketch/1/explore)
and start browsing the data you have. What do you notice? What are the three
timelines we’ve collected? Hint: look at the data_type field in the events
from each timeline.
Run the Tagger analyzer
In your Timesketch sketch’s explore view, type _exists_:yara_match. You’ll see
a list of events appear, all coming from the same timeline (why?). Open one of
them, and look for the attribute yara_match.
yara_match attribute contains a list of Yara rules
that matched the file. In this case, we’ve used a series of “classification”
Yara rules, that will just give us an idea of what kind of file we’re looking
at. This will come in handy later on.It’s very annoying to have to open the event attributes every time we want to know what kind of file this is. Fortunately, there is a simple Timesketch analyzer that can extract these fields and tag events with its contents.
Click on the “+” next to “Analyzer results” on the left hand side of the page. In the search bar, select all timelines (you could filter out the timelines that do not contain these attributes to save some resources.)
Search for the “Tagger” analyzer, and click on the Play button next to it. The analyzer takes a few seconds to run, and you’ll see “Analyzer results (3)” on the left hand side of the screen. Click through Analyzer results → Tagger to see results for each timeline:
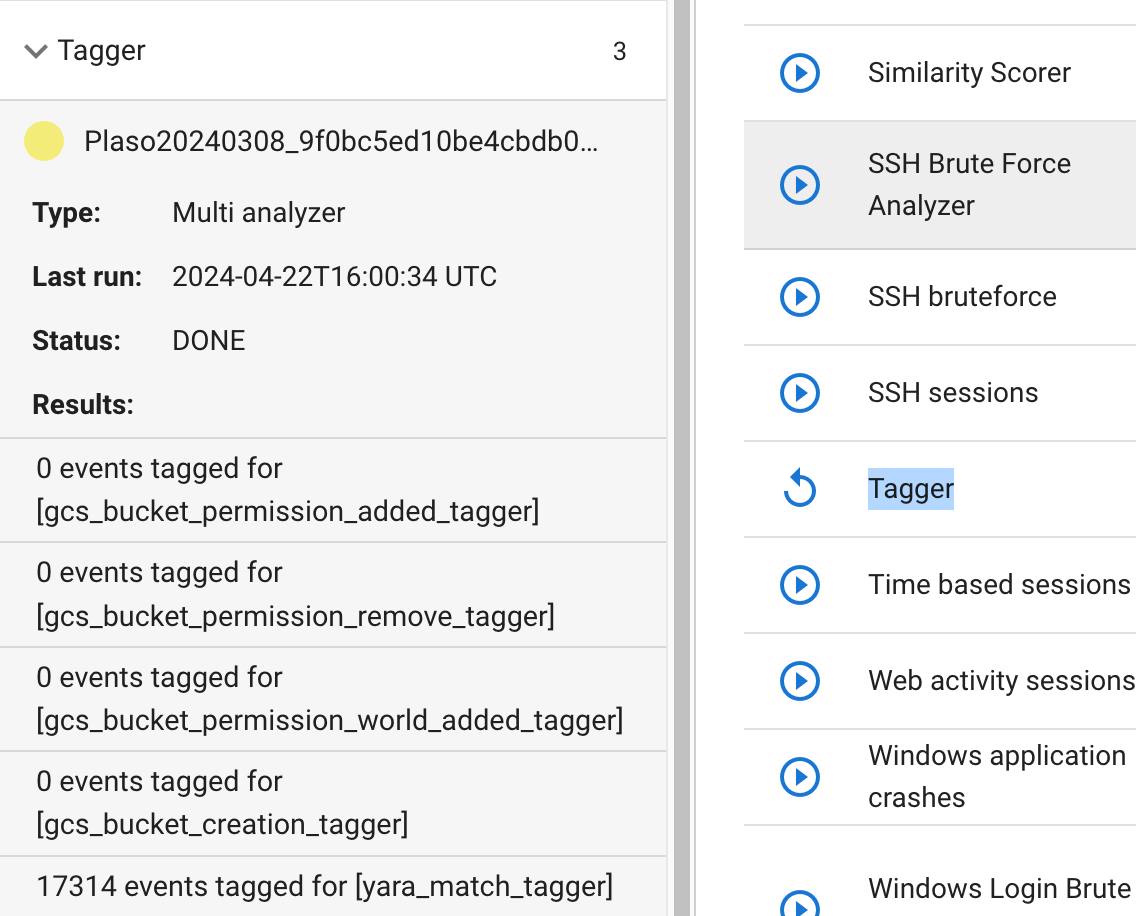
Almost 17k events tagged in just a few seconds. Head back to “Search” (top left) and click on the search bar. A popup will appear (if it doesn’t refresh the page):
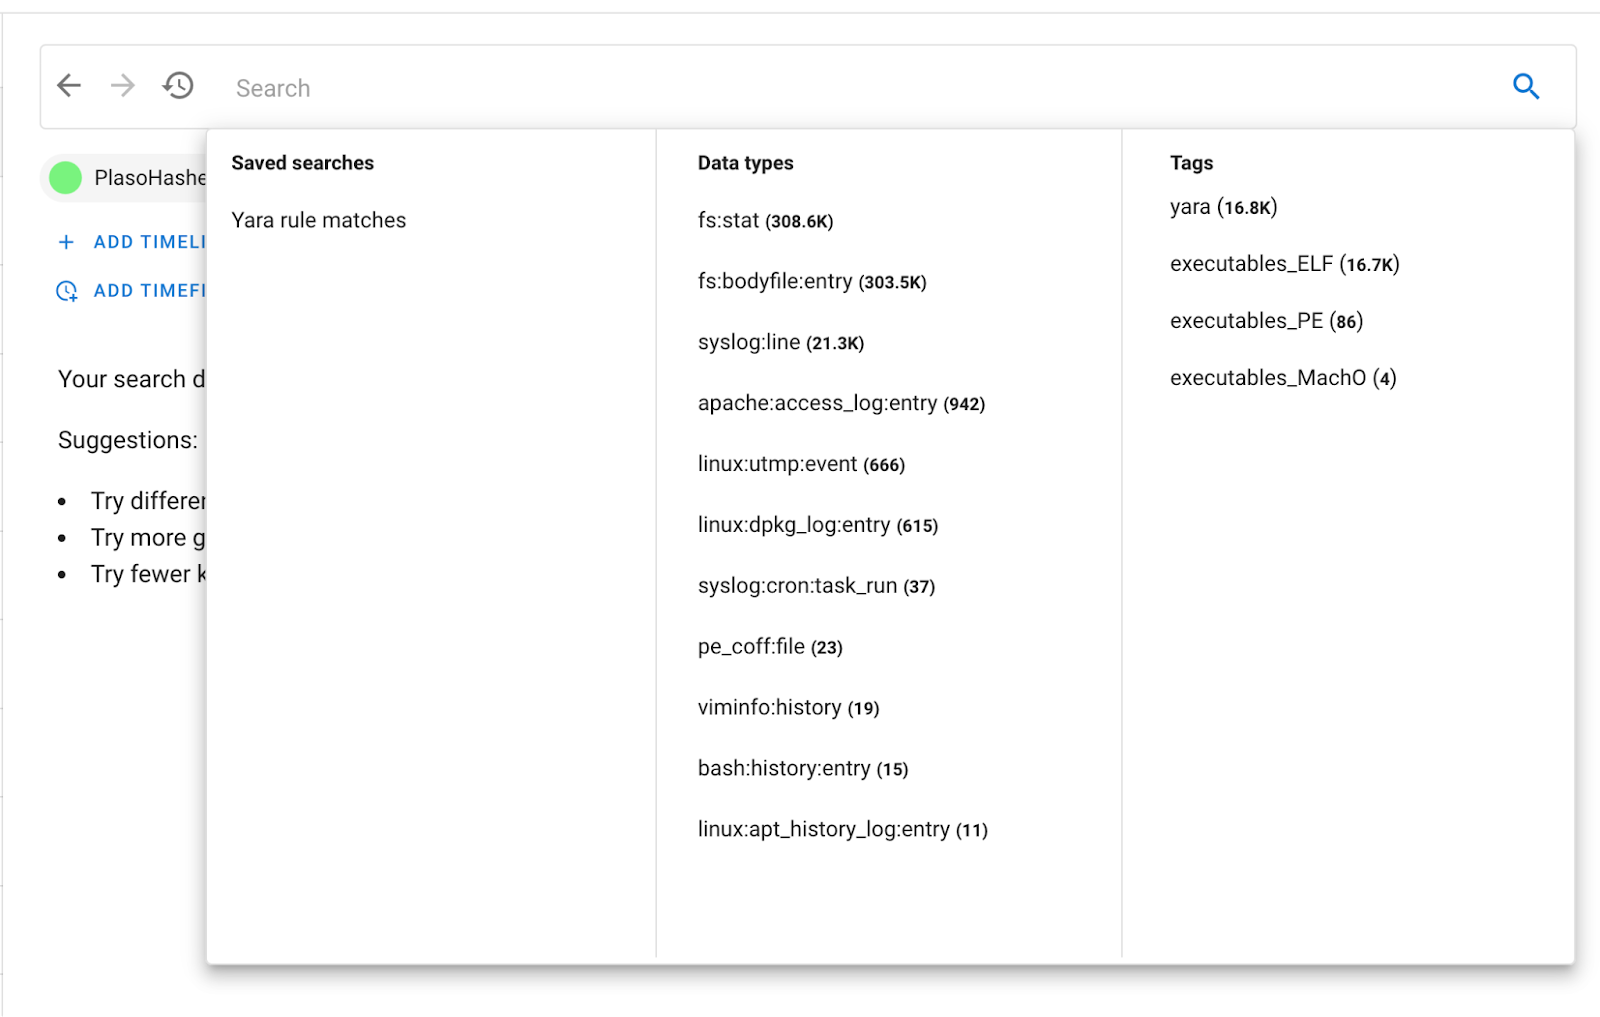
You have a helpful aggregation of tags on the right. Where there were none before, now we have some! 16.7k of the files that were tagged are ELFs, with some others also tagged PE and MachO. You can now see the tags directly in the event list:
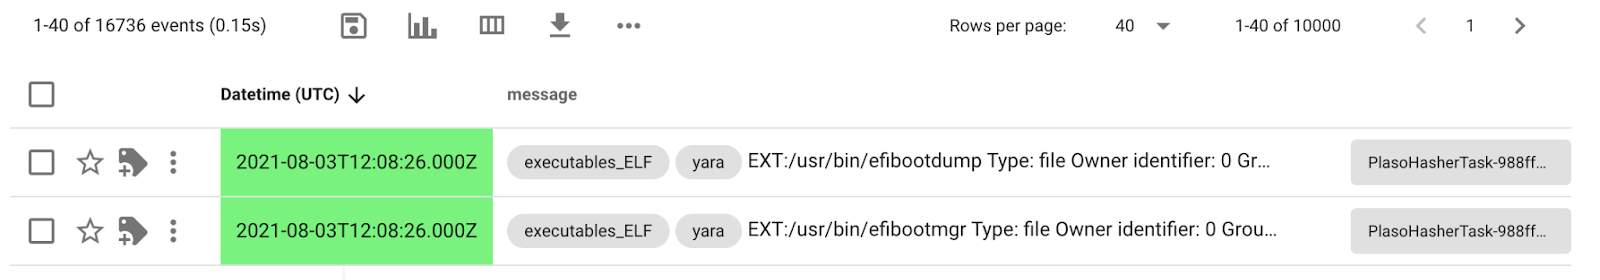
This already gives you an idea of what kind of system you’re looking at, and can come in very handy if you want to, for example, look at the latest ELF files that were created on that disk. (this would yield interesting results for this investigation)
Run the Yeti analyzer
Repeat the process for running analyzers, but this time select all available timelines. Head down to the Yeti forensics triage indicators analyzer and click the Play button.
This analyzer will focus on Yeti’s triage entities, unroll the graph of indicators linked to them, and search for those indicators in your sketch.
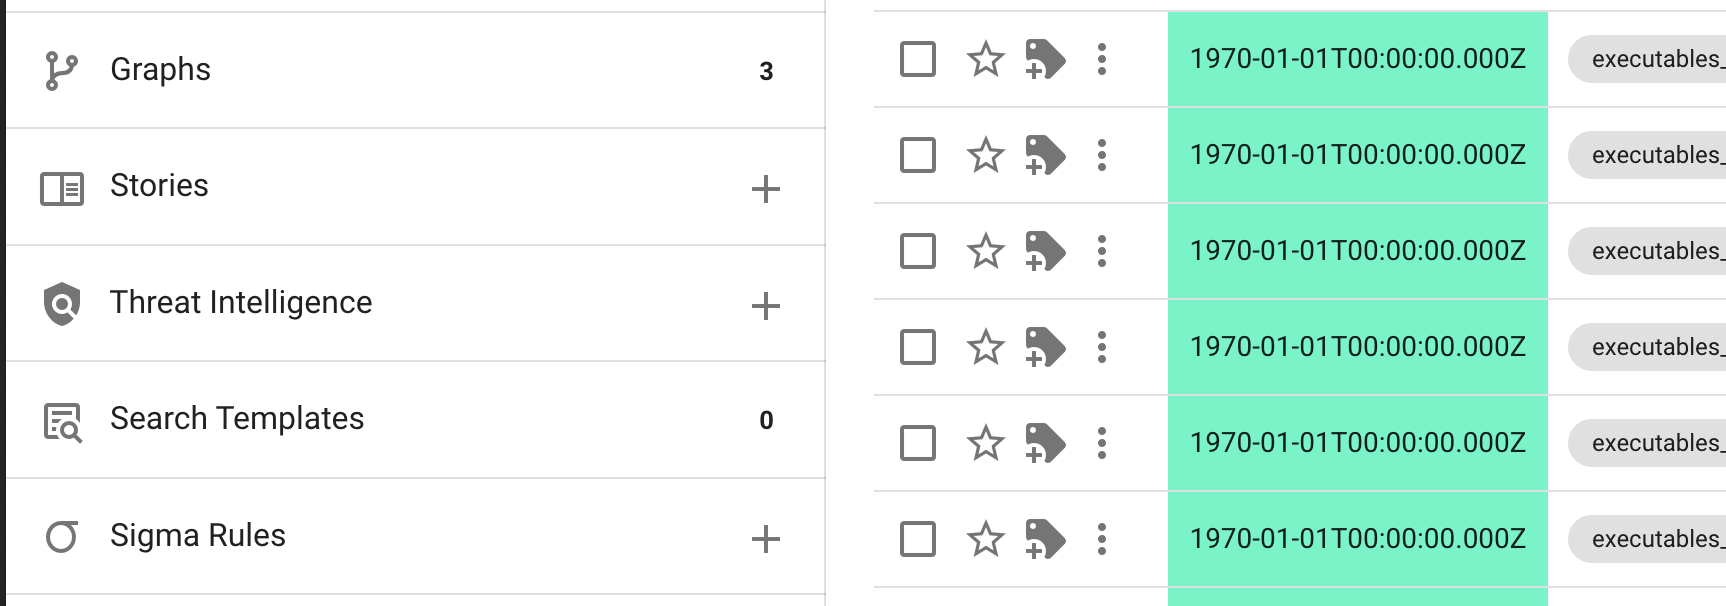
After a few seconds, you should see this:
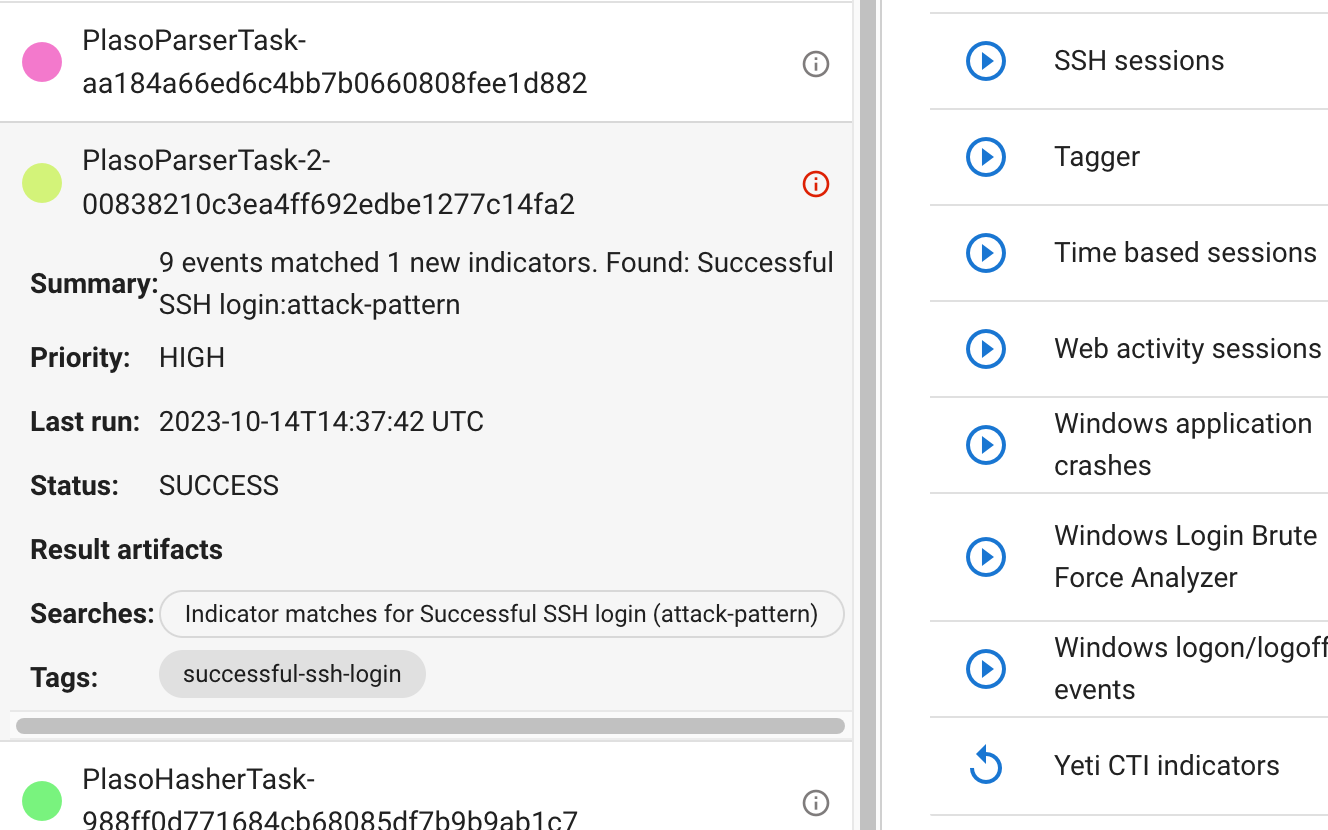
The main search bar also has new additions:
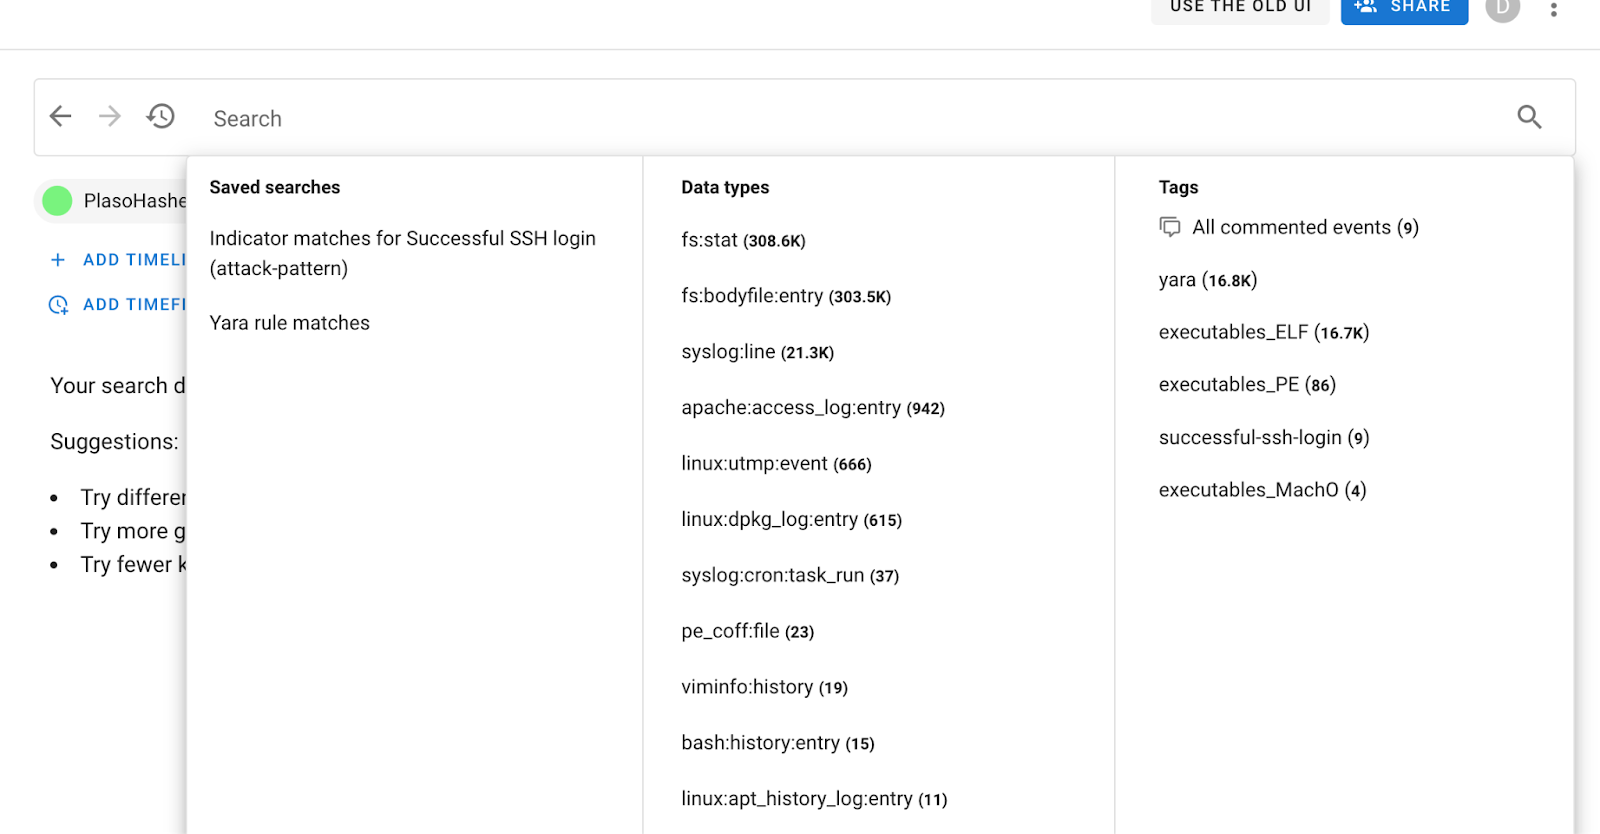
You can click on the Indicator matches for SSH accepted login or the
ssh-login tag to filter out events highlighted by Yeti. Or, search for
tag:"successful-ssh-login" in the search bar.
Find the intrusion vector
What stands out of these SSH logins? Play around with timesketch to figure out what happened around the time of each connection. Are they legitimate?
You can run context searches around the events of interest:
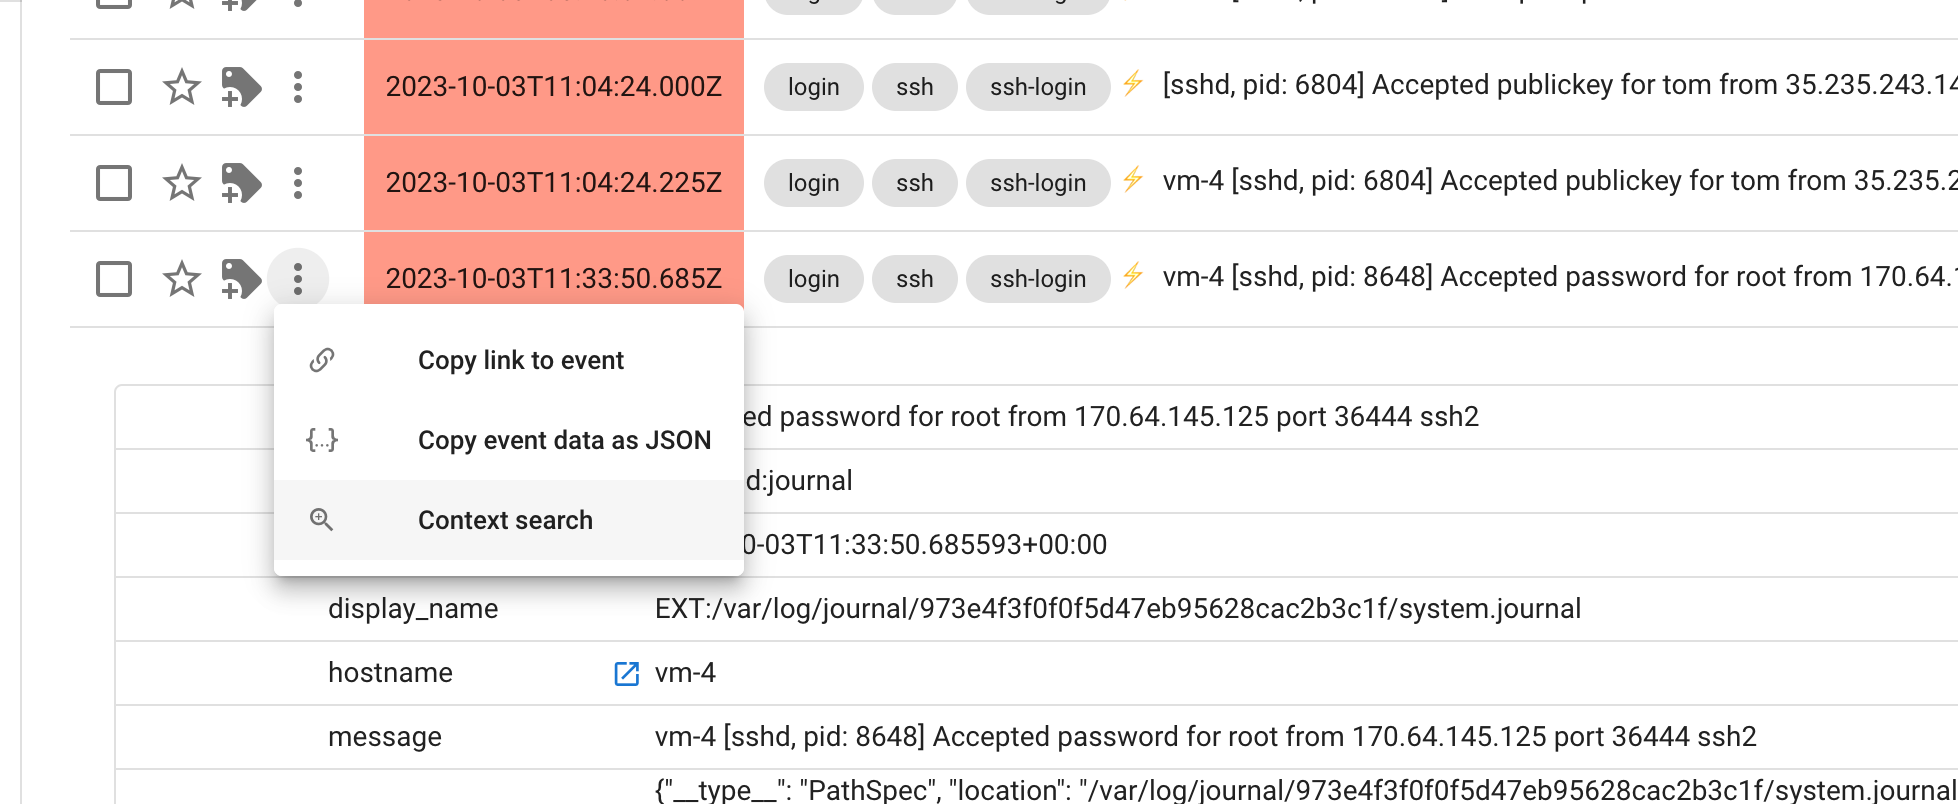
This will bring up a popup where you will see all events happening 5 minutes around the event you’re interested in. This is very useful for finding other interesting events by “pivoting” on timestamps.
Find the malware
Start by pivoting on the time the SSH connection happens, and clear the search
to look at all events. What previous sketch automation can we leverage to find
interesting things (maybe the executables_ELF tag is interesting?)
Annotate intelligence in Timesketch
How do we keep track of intelligence we’ve been finding in Timesketch? Look at the “Threat intelligence” section on the left.
In terms of IOCs, so far you should have found:
- The IP used for logging into the system
- The location of the malware in the filesystem
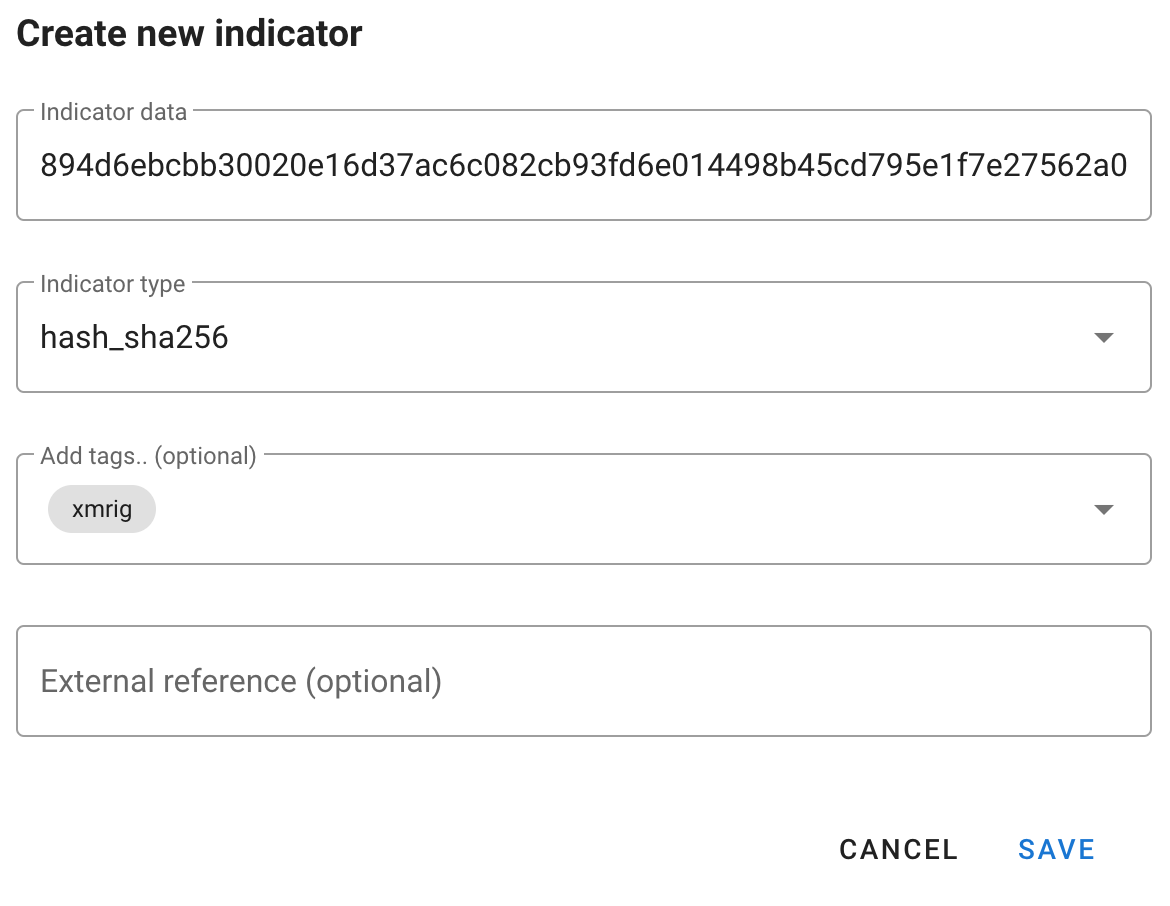
- Its hash
Let’s add all of these to the intelligence section of timesketch. Click the + button, and add away.
You can click on the pencil icon to go to a “wider” view of intelligence on the sketch:
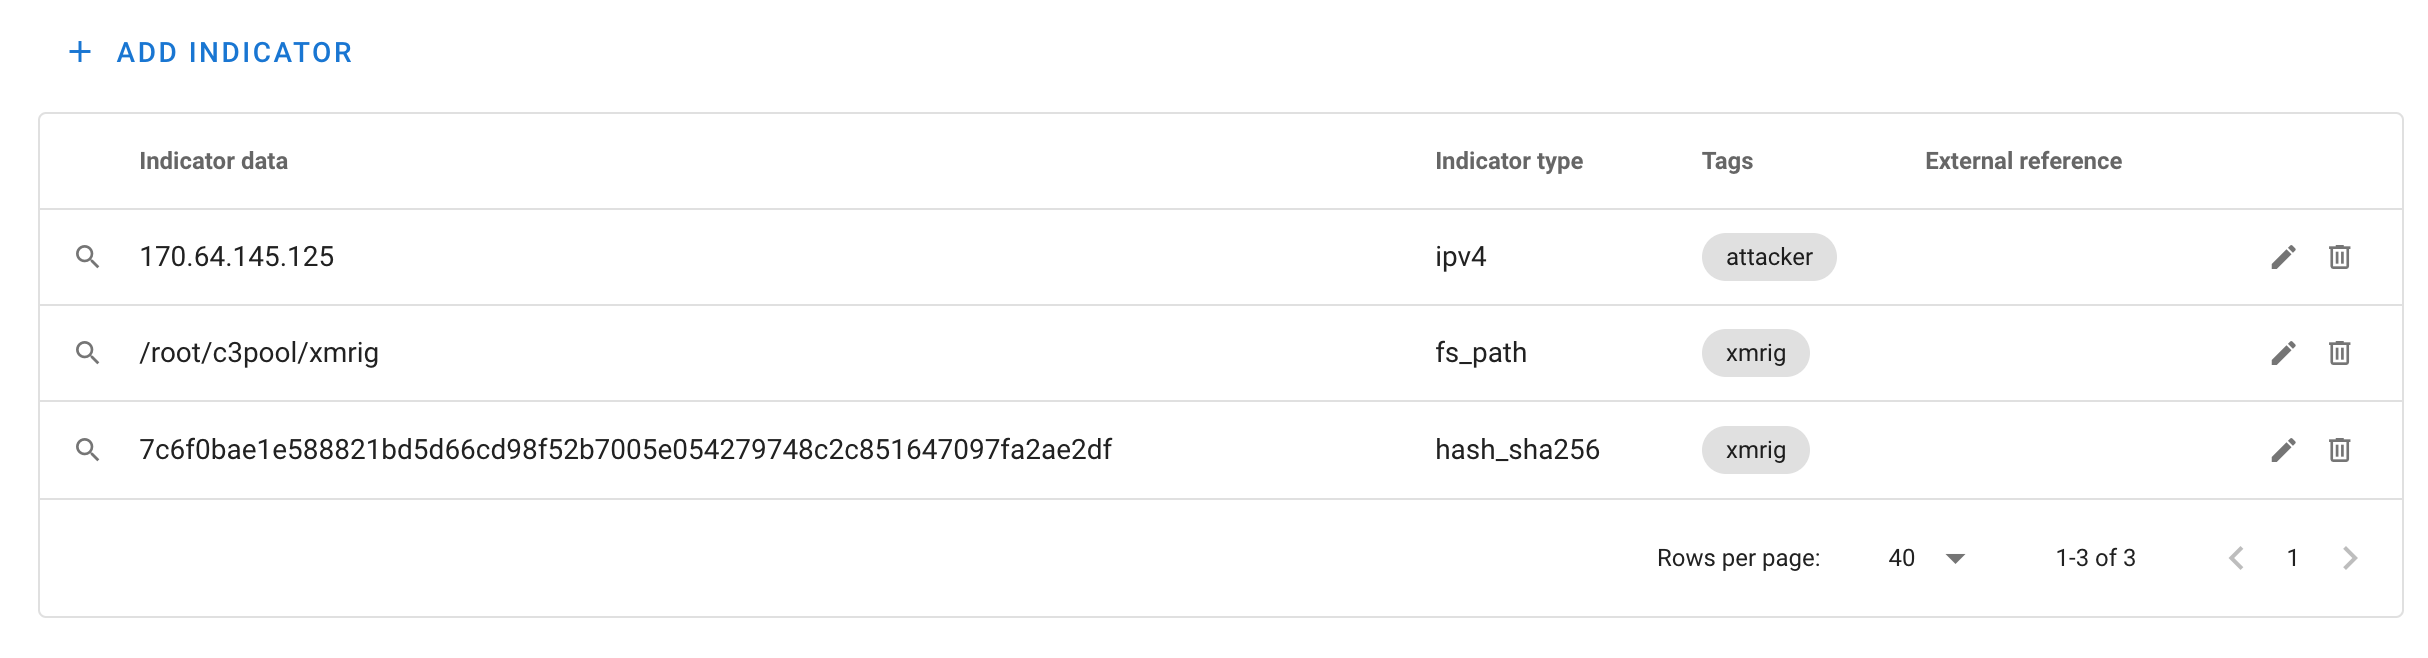
Here you can curate, edit, remove any items you deem unnecessary or unworthy of being exported. You can also click on the magnifying glass on the left to see all other events that match those IOCs.
As an investigator, this kind of work is good because then CTI teams can capitalize on this and disseminate that intelligence to other teams (or future you when you run into a similar case again)
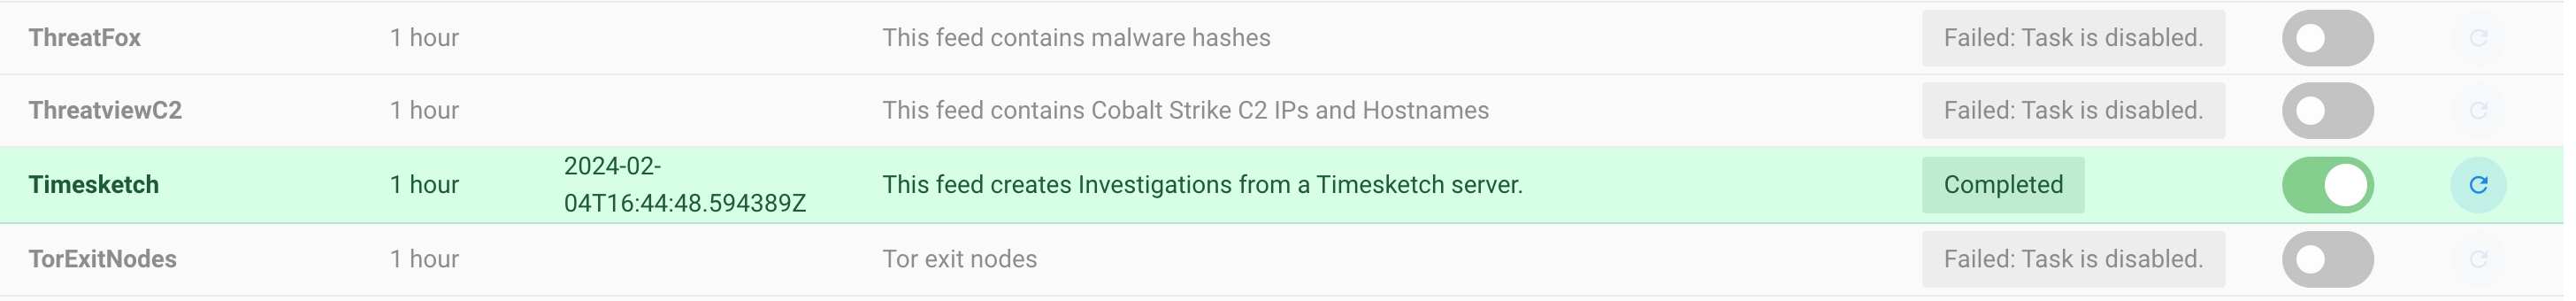
Import and document CTI in Yeti
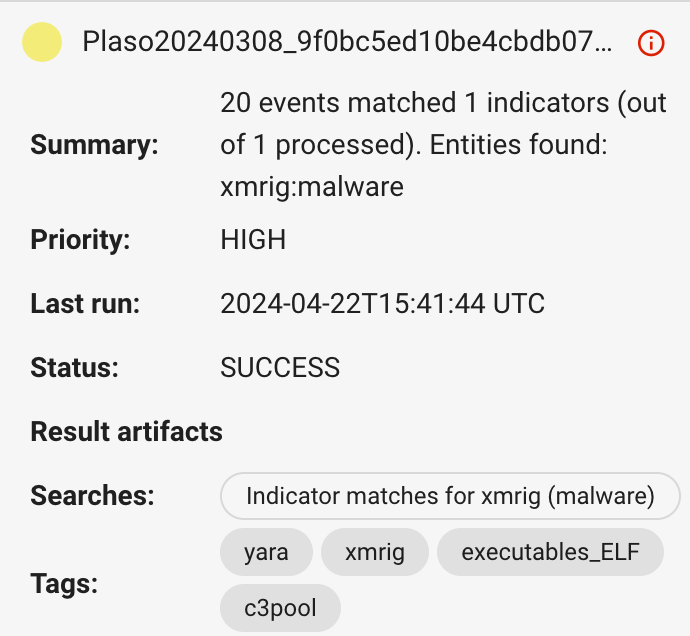
Head to Yeti, then Automation in the menu bar, then Feeds. Search for the Timesketch feed, enable it, and click on the refresh icon to run it (enabled feeds run periodically as well). After a few seconds, it should look like this:
Head to the Entities menu, and you’ll see a brand new Investigation appear in there. Click on it, and you’ll see some information imported from Timesketch:
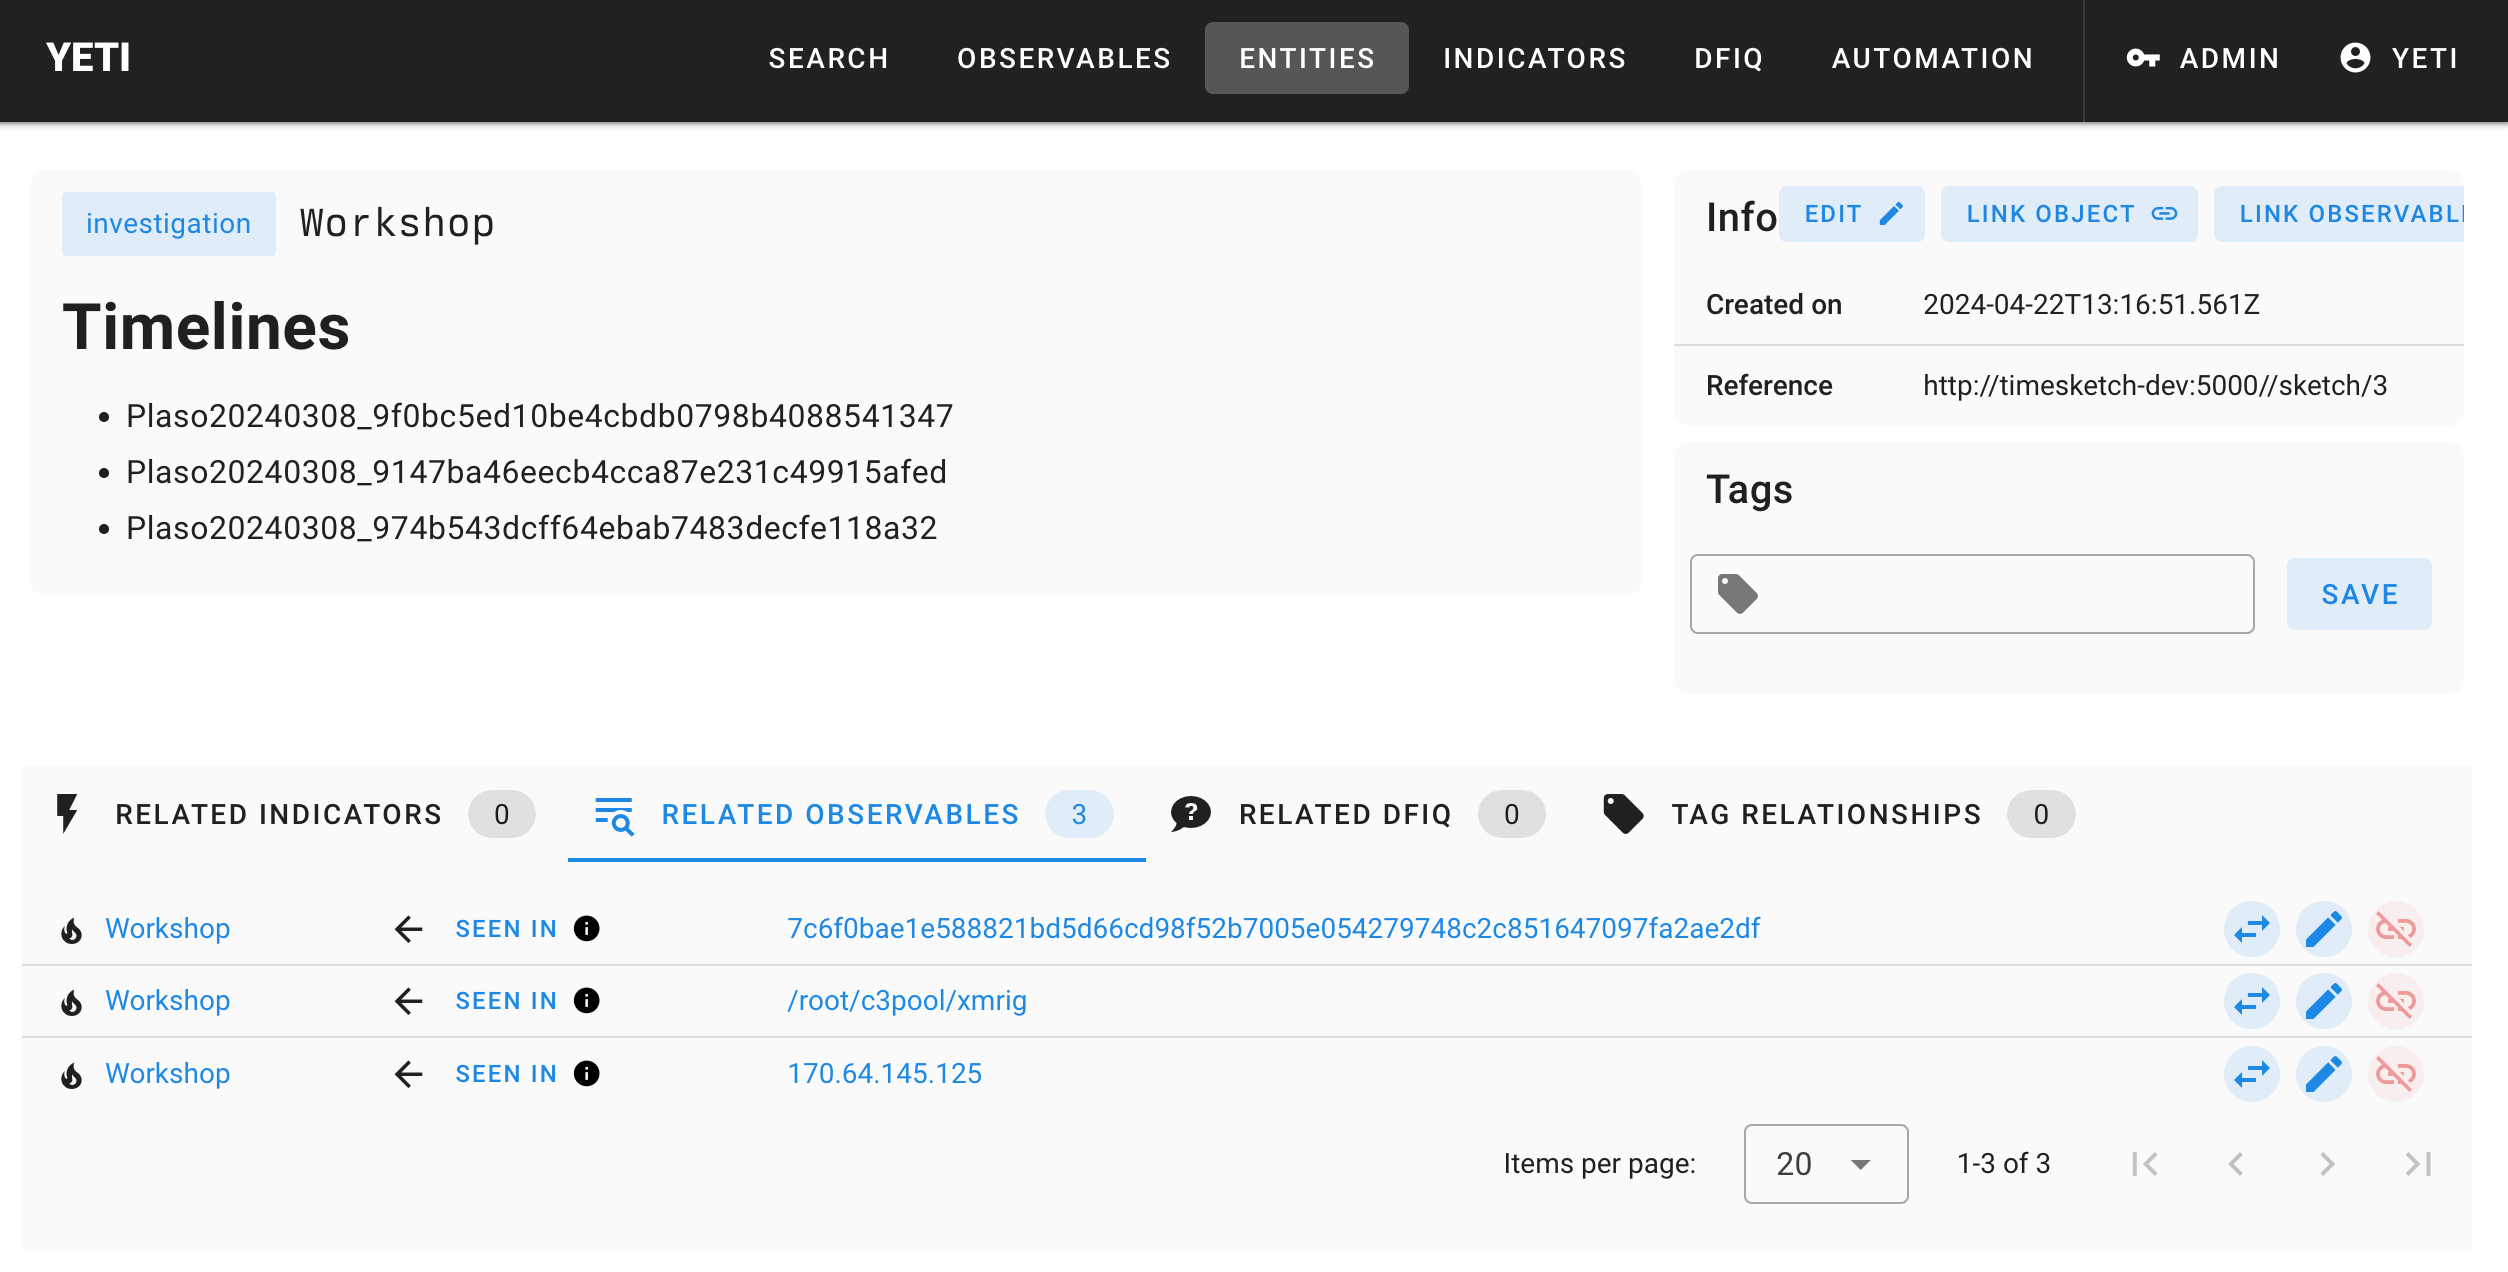
The filename gives us a solid clue of what the malware in question could be. If it didn’t, you’d probably hand it off to your reverse engineering team to tell you what it is. This is xmrig, a common cryptominer. Time to document this.
New Malware: xmrig
- Name:
xmrig - Family:
cryptominer - Aliases: Optional.
- Description: Optional.
You also want to document the dropped filenames in Yeti so that they can get
quickly flagged by an analyst running into similarly compromised systems. What
you choose to document is really up to you, but one interesting pattern is to
look for is filesystem entries that contain c3pool.
New indicator: c3pool files
- Name:
c3pool files - Pattern:
(/[a-z0-9]+)+/c3pool/[^/ ]+ - Location:
filesystem - Relevant tags:
c3pool - Diamond model:
capability
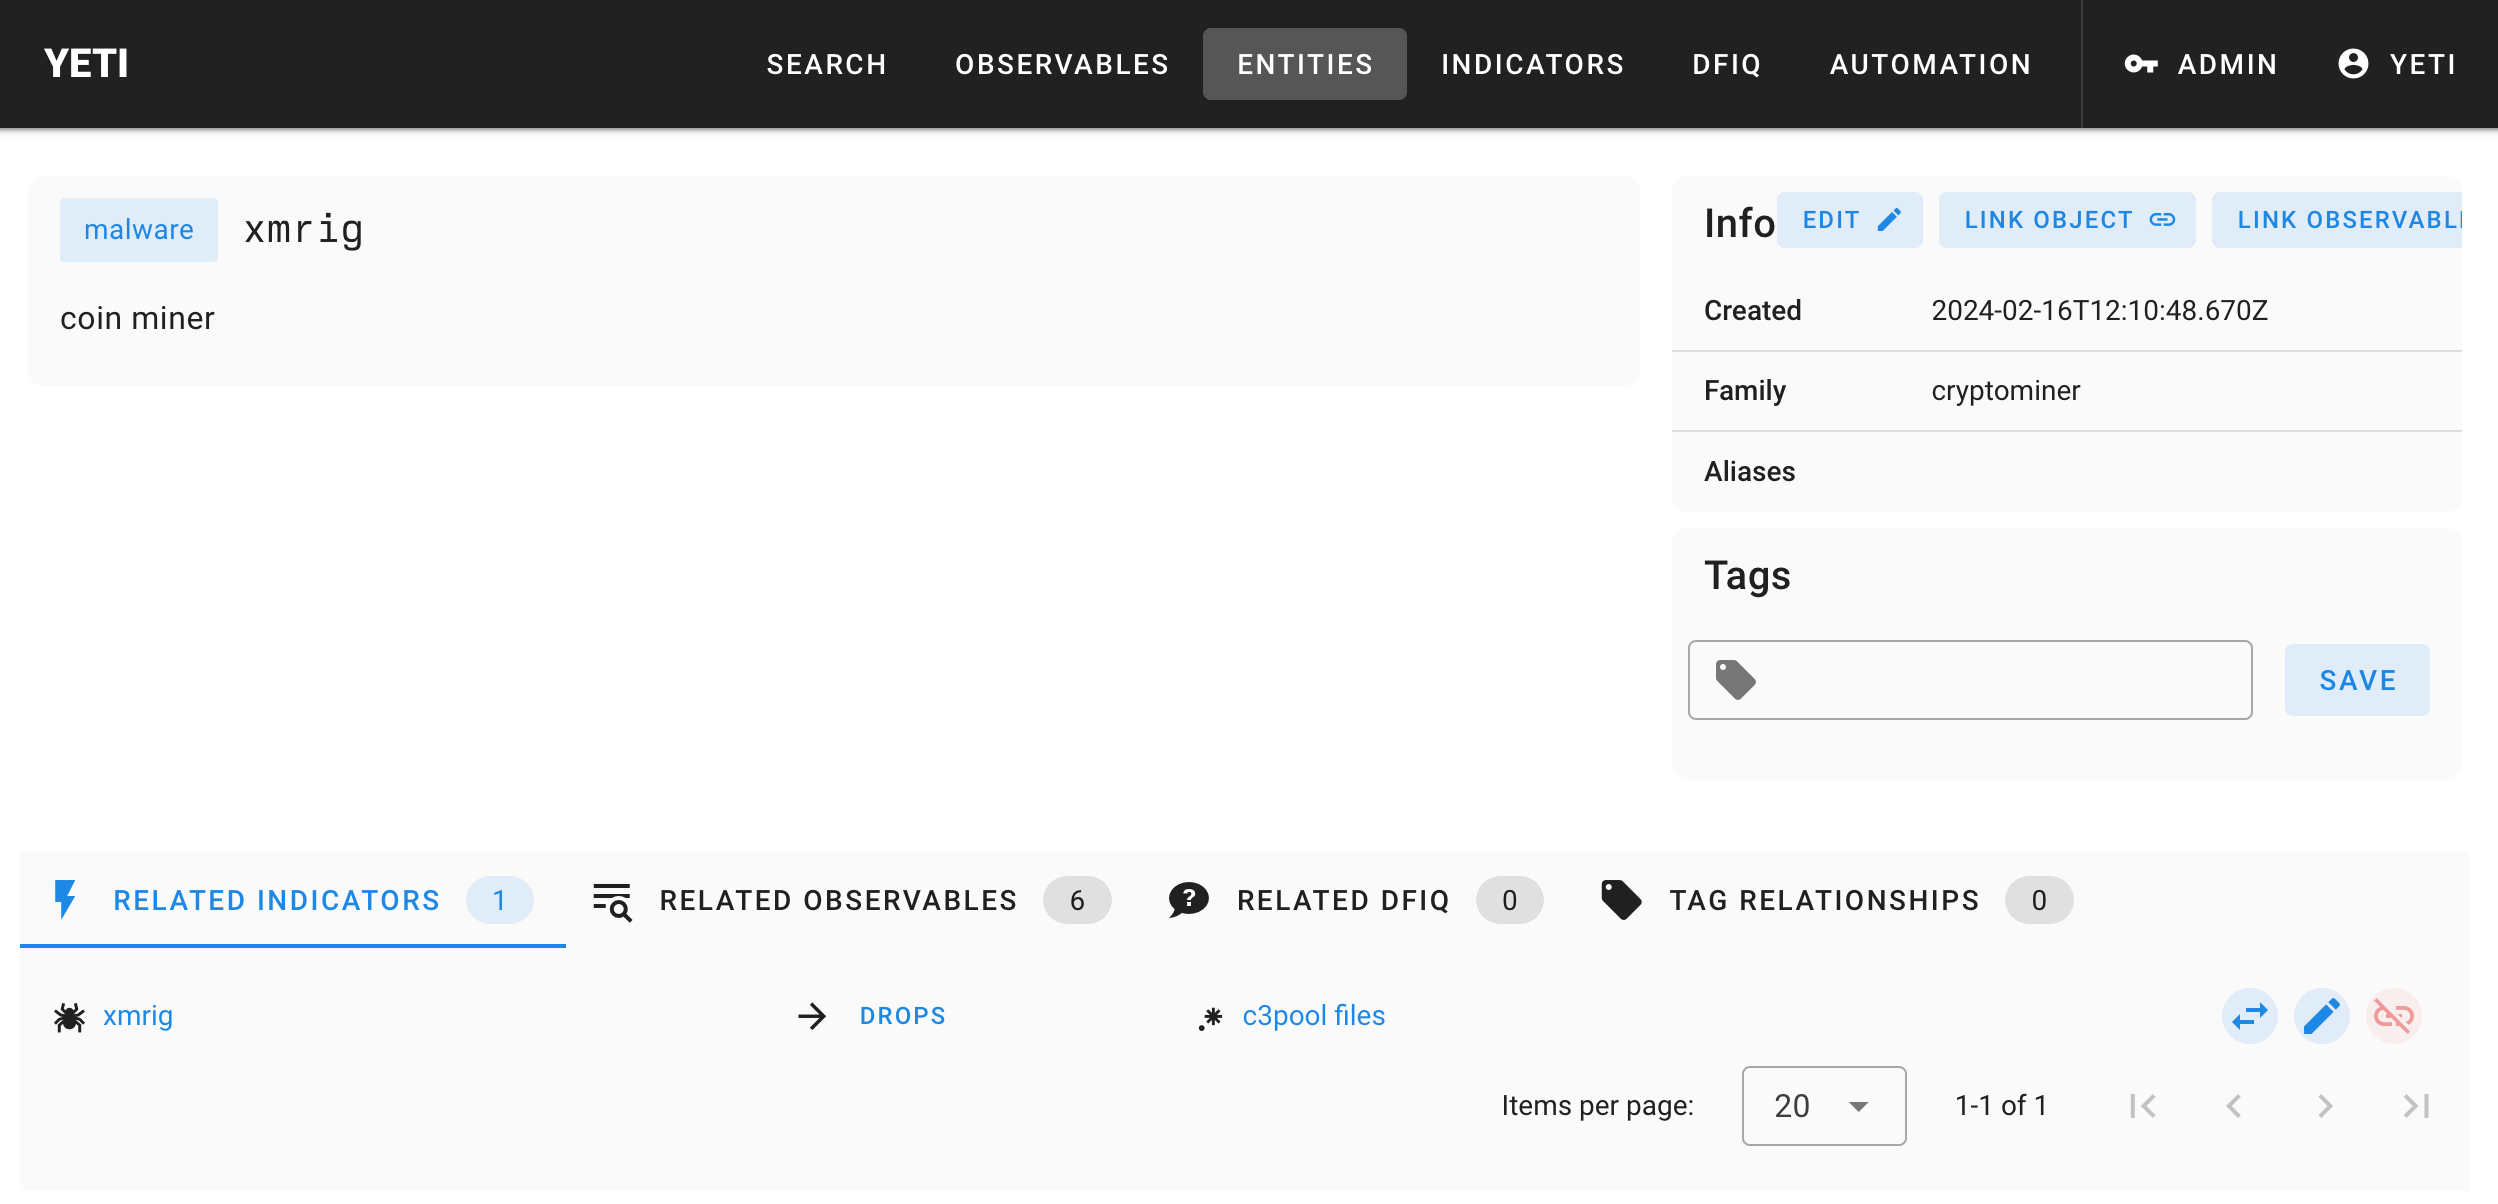
Link the two objects
The way the Timesketch analyzer looks for malware indicators is similar to the triage indicators, except it will start with entities of type “malware” (no matter what they’re tagged with). We still need to link the malware entity to its appropriate indicator, so head to the xmrig page and use the “Link object” button to link it to your freshly created indicator.
You should have something like this:
Run the Yeti malware analyzer
Try it out! Head back to your sketch and this time run the
Yeti badness indicators analyzer, and see if it produced any new tags on your
sketch.
Click on the xmrig tag, or go through the saved search, and you’ll find many
other goodies such as bash files that are related to your investigation.
You’ll see that the intelligence page has been populated with new findings
(mostly the filesystem paths to the c3pool directory). At this point, you can
try re-running the Timesketch feed in Yeti to import these new elements.
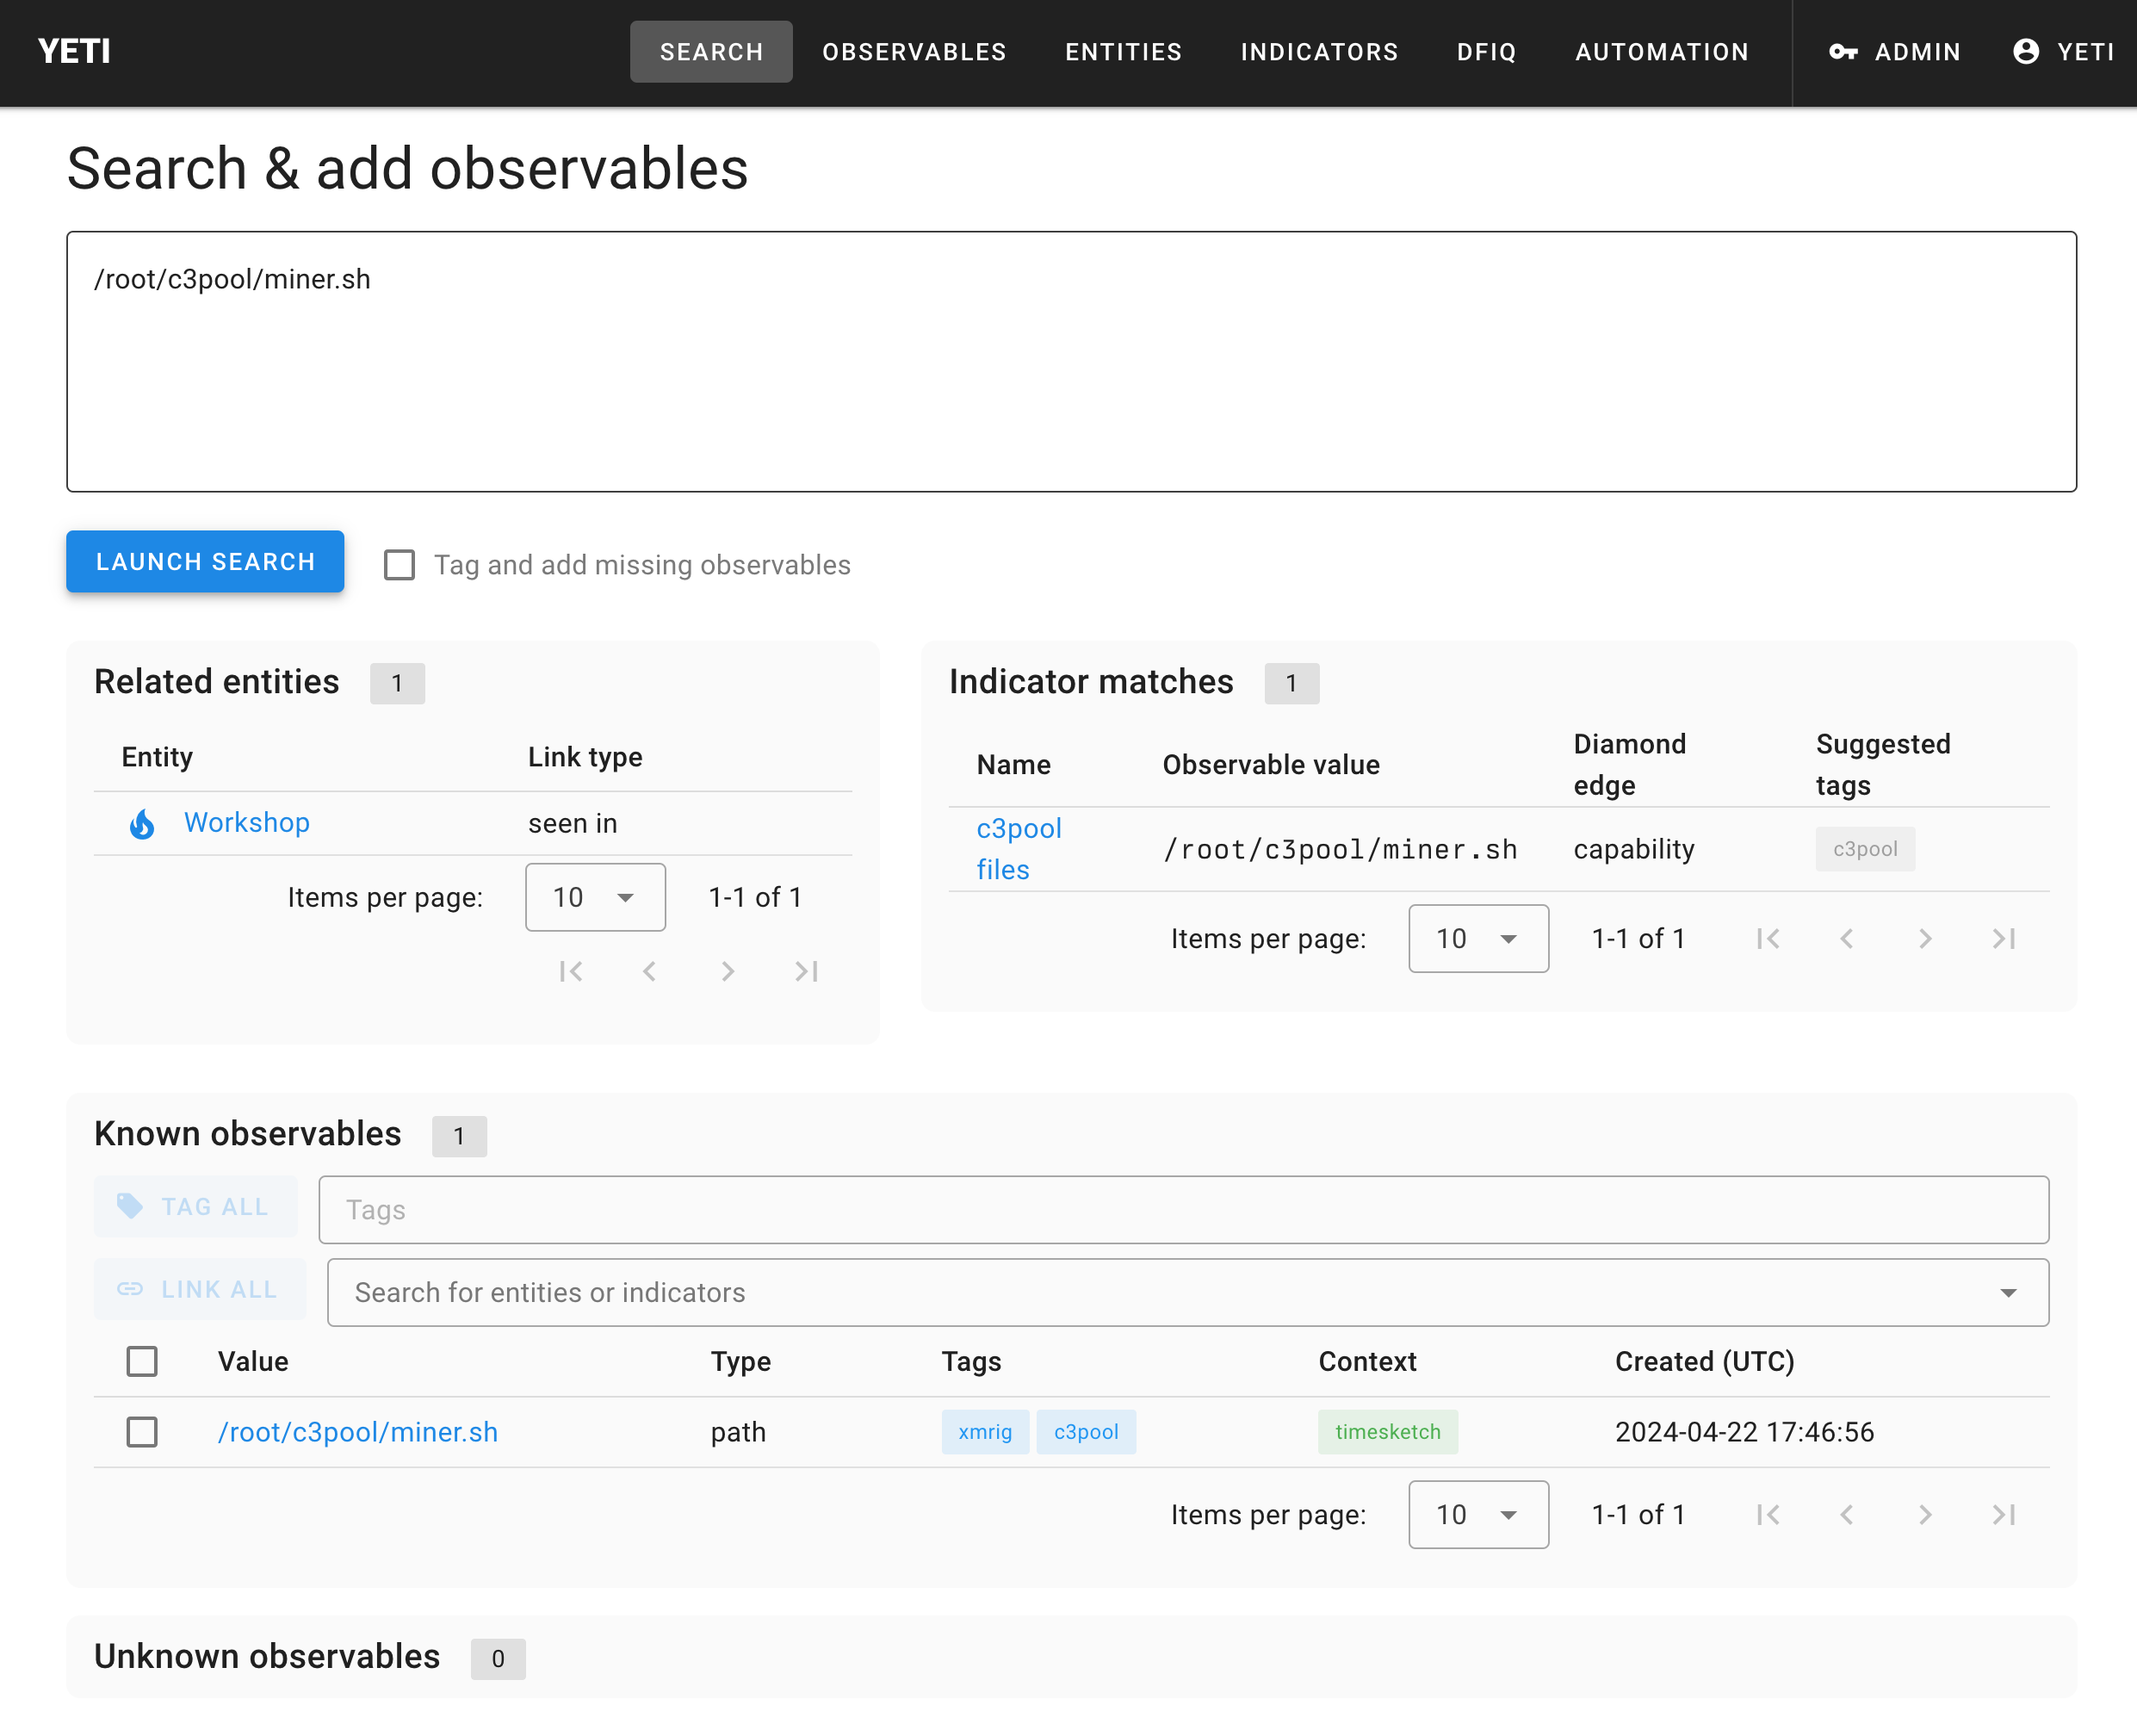
Finally, now that you have some good documentation, imagine you’re someone who comes across this weird c3pool directory, and you want to know if it’s been seen before. Head to the Yeti Search page, and paste the path in the search box:
Leveraging CTI from previous investigations
Now that you’ve documented threat intelligence in Timesketch and imported it into Yeti, Timesketch can also use Yeti to search for indicators that appeared in previous investigations.
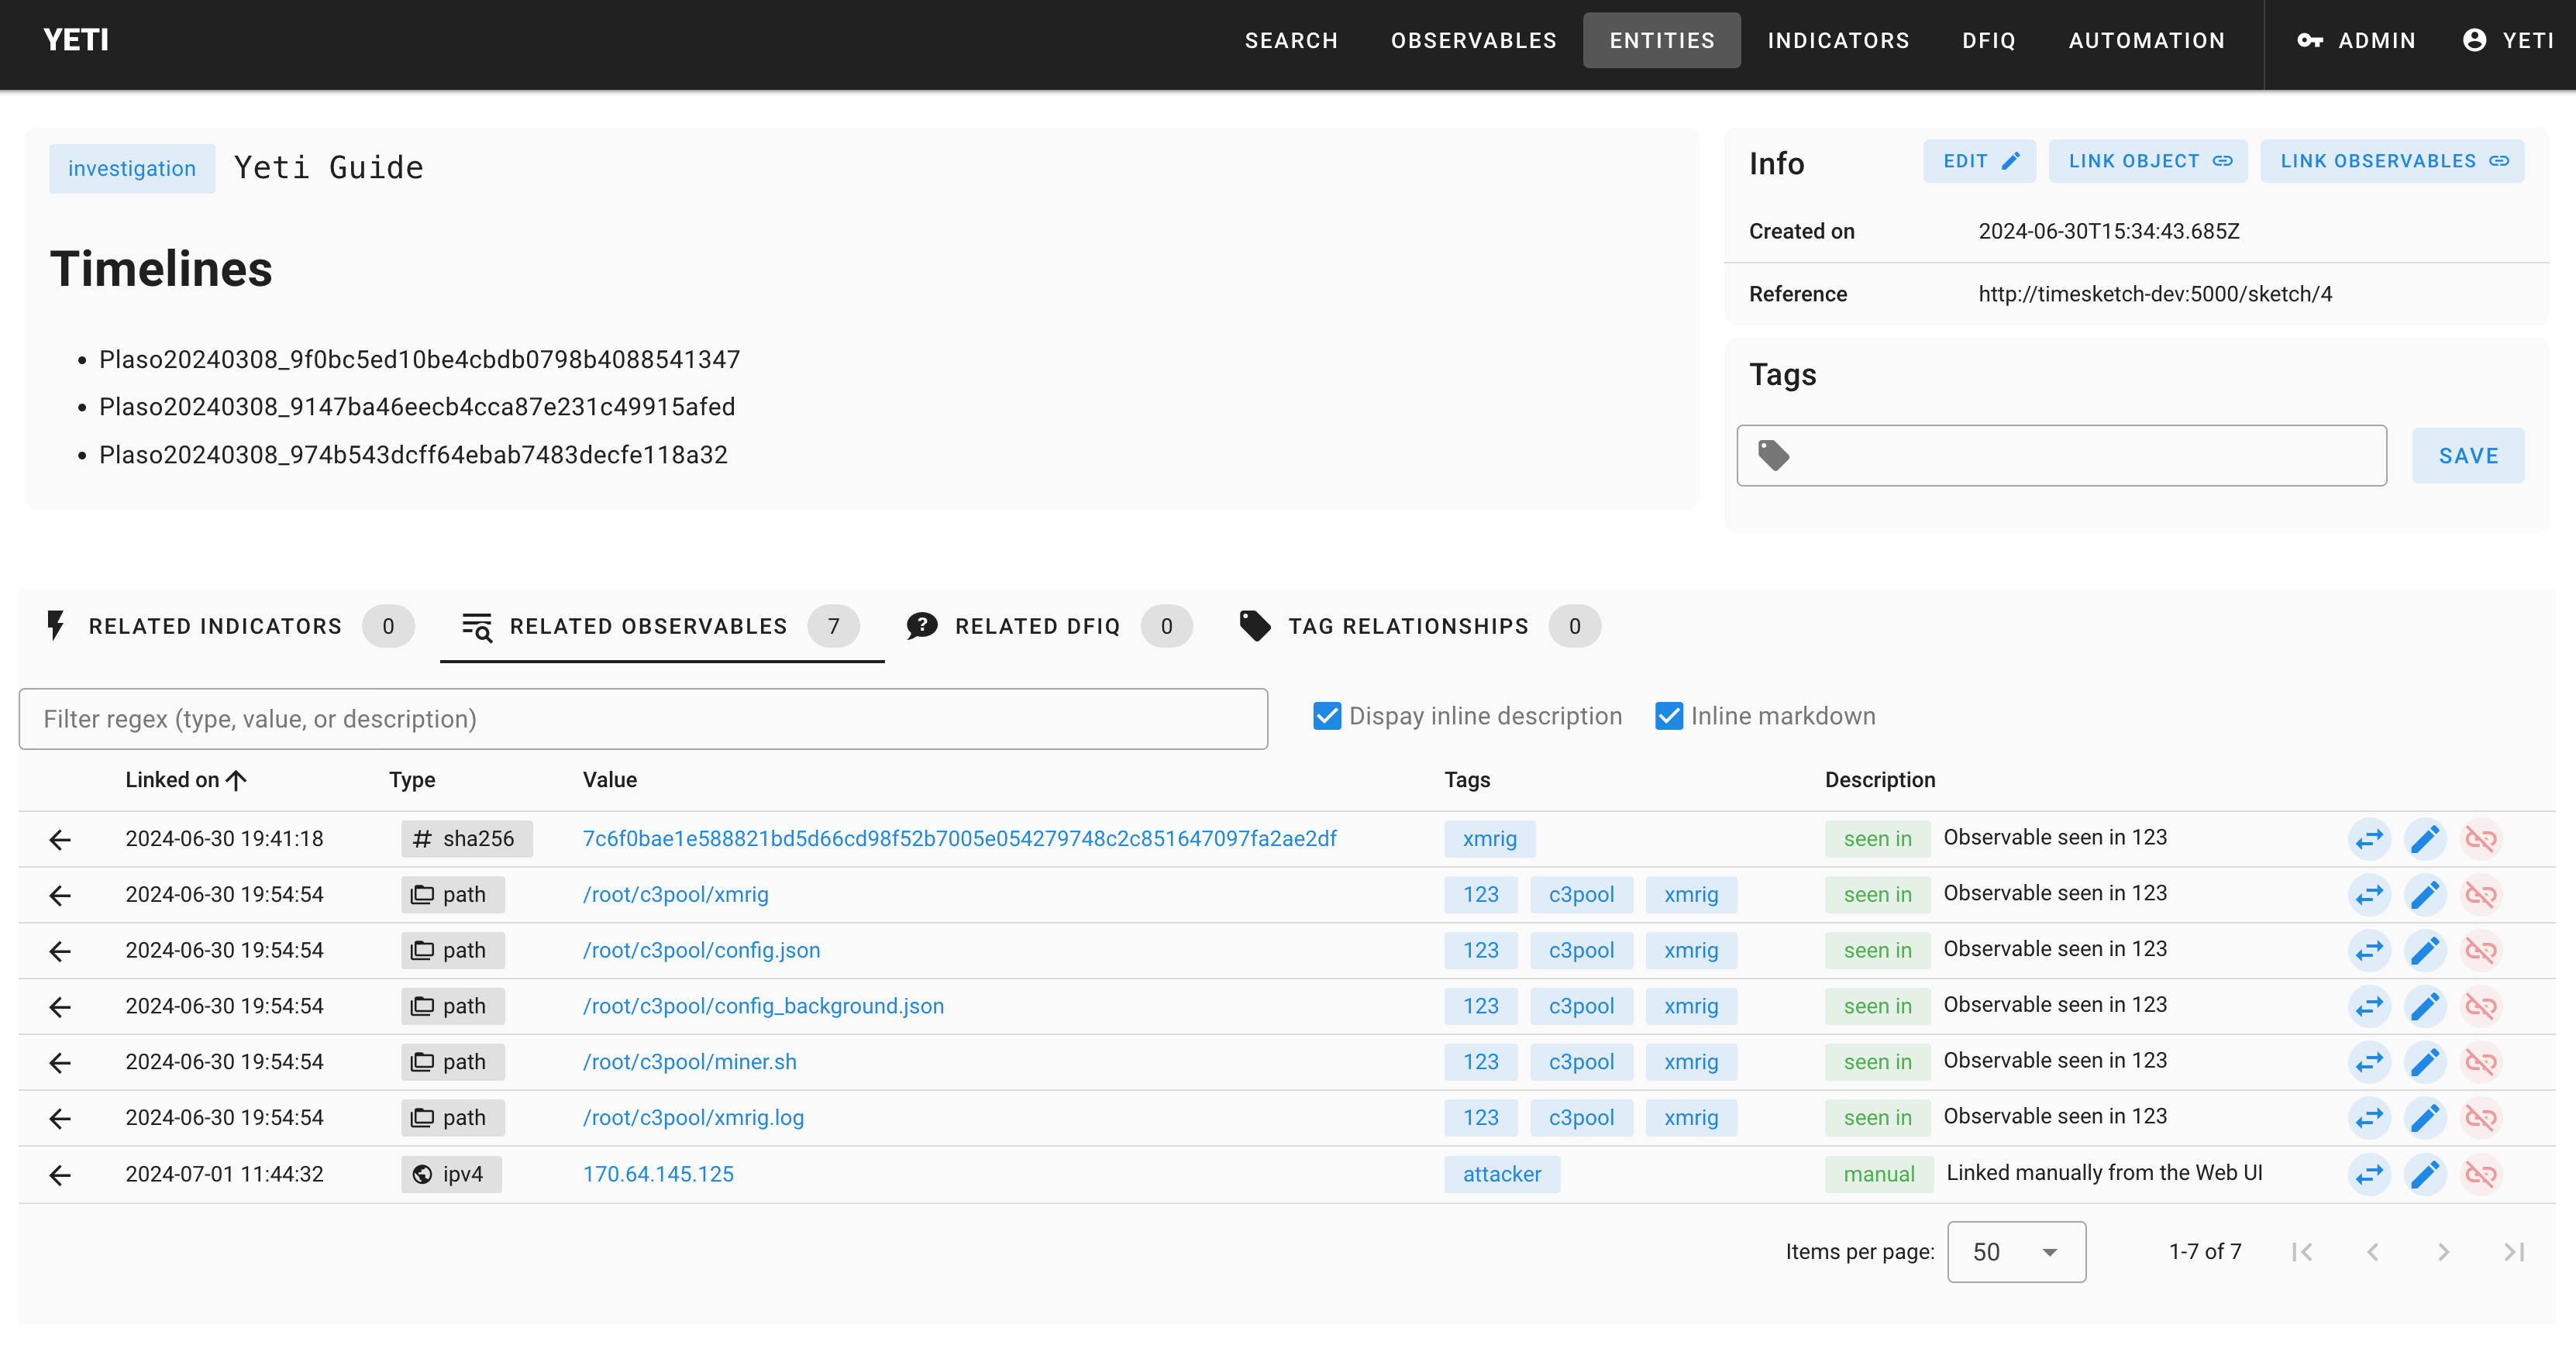
Your investigation Entity in Yeti should look like this (re-run the Timesketch feed if it doesn’t):
Imagine another analyst runs into a similar case in the future.
To simulate this, we’re going to create a new sketch in Timesketch and upload the same plaso files. Once that’s done, run the Yeti Investigations intelligence analyzer on all timelines of the new sketch.
You’ll notice many more events tagged this time around. If you’ve documented the attacker IP address, you’ll see that all activity from that IP address will have been tagged. What does this tell you about how the attackers got onto the system?